![]() Norbert Smith 2025-10-09
Norbert Smith 2025-10-09
Your Practical Guide to JMeter Load Testing
Learn to master website performance testing with our practical JMeter tutorial. Follow our step-by-step guide to build test plans, simulate real users, and analyze results to eliminate bottlenecks.

The Foundation of Performance Reliability
A website crash during a Black Friday sale can erase weeks of marketing efforts in minutes. We have all seen headlines about major retailers going offline during peak traffic, a stark reminder that performance is not a feature but a prerequisite for business survival. This is why proactive testing is non-negotiable. Load testing is the practice of simulating real-world user traffic on your website to see how it holds up. Think of it like a bridge engineer testing a new bridge with increasing weight to confirm its capacity before opening it to the public. The goal is to find and fix weaknesses before your actual customers do.
This process is about ensuring stability and reliability under expected conditions. It answers the question: "Can our website handle the traffic from our upcoming marketing campaign?" It is different from other types of performance testing, each with a specific purpose. Understanding these distinctions helps you choose the right approach for your goals.
Testing Type | Primary Goal | Typical Scenario |
|---|---|---|
| Testing Type Load Testing | Primary Goal Verify performance under expected user loads | Typical Scenario Simulating traffic for a typical business day or marketing campaign. |
| Testing Type Stress Testing | Primary Goal Find the system's breaking point | Typical Scenario Gradually increasing load far beyond normal capacity until it fails. |
| Testing Type Soak Testing | Primary Goal Assess long-term stability and find memory leaks | Typical Scenario Running a sustained, moderate load for an extended period (e.g., 8-24 hours). |
| Testing Type Spike Testing | Primary Goal Evaluate response to sudden, massive traffic surges | Typical Scenario Mimicking a viral social media post or a flash sale announcement. |
Fortunately, you do not need a massive budget to start. Apache JMeter stands out among website performance testing tools as the industry-standard, open-source solution. It makes this critical testing accessible, allowing teams of any size to build a more resilient digital experience.
Preparing Your JMeter Environment for Testing

Before you can simulate a single user, you need a solid foundation. This pre-flight checklist ensures your testing environment is correctly configured, saving you from headaches later. The process of how to use jmeter for load testing begins with proper setup, not with scripting.
- Install the Java Development Kit (JDK): JMeter is a Java application, so it needs a compatible JDK to run. A quick search for the latest stable JDK version and a check of your system's command line will confirm if you are ready.
- Download and Launch JMeter: Head to the official Apache JMeter website, download the latest binary, and unzip it. You can launch the graphical user interface (GUI) by running the
jmeter.bat(for Windows) orjmeter.sh(for Mac/Linux) file.
Once open, you will see two main areas: the Test Plan and the Workbench. The Test Plan is where your final script will live. The Workbench is a temporary scratchpad for building and experimenting with test elements. The most important step, however, happens before you add a single element. You must define your objectives. What are you trying to validate?
- What specific user flows are most critical to your business, like logging in, searching for a product, or completing a checkout?
- What is the anticipated peak number of concurrent users you expect?
- What are the acceptable response time thresholds for your key pages?
Answering these questions focuses your efforts. Finally, prepare a clean test environment with dedicated test user accounts and realistic data. This prevents you from polluting production databases or getting skewed results from cached responses. A robust website is also essential for adapting to new discovery methods, a topic we cover when preparing your website for the AI search era.
Building Your First JMeter Test Plan
With your environment ready, it is time to build your first script. We will start with the essential components for a simple, single-page test. This foundational knowledge is the first step in jmeter scripting for beginners and provides an immediate, functional takeaway. A basic test plan consists of three core element types: a Thread Group, a Sampler, and a Listener.
Simulating Users with the Thread Group
The Thread Group is the engine of your test. It defines the virtual users who will generate load on your website. When you add a Thread Group, you will see three key settings:
- Number of Threads (users): The number of virtual users you want to simulate.
- Ramp-Up Period (in seconds): The time JMeter should take to get all threads running. A 10-second ramp-up for 10 threads means one user starts every second.
- Loop Count: How many times each user will repeat the test.
Sending Requests with Samplers
Samplers are the instructions that tell your virtual users what to do. The most common one is the HTTP Request sampler, which sends a request to a web server. You simply fill in the server name (e.g., yoursite.com) and the path (e.g., /contact). This sampler measures the time it takes for the server to send back its initial response, a metric closely related to document request latency .
Viewing Results with Listeners
Listeners collect and display the results of your test. For a first test, two are essential. The View Results Tree listener shows the details of every single request and response, which is invaluable for debugging your script. The Summary Report listener provides a high-level overview of key metrics like average response time and error percentage. Here is a simple jmeter test plan example to get you started:
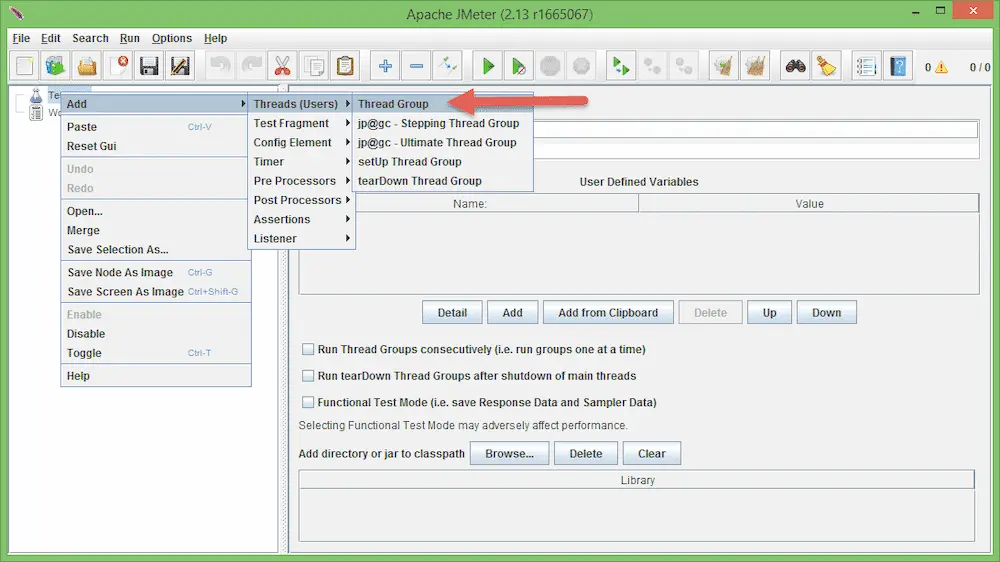
- Right-click on your Test Plan > Add > Threads (Users) > Thread Group.
- Right-click on the Thread Group > Add > Sampler > HTTP Request.
- Right-click on the Thread Group > Add > Listener > View Results Tree.
With these three elements configured, you have a functional test plan ready to run.
Crafting Realistic User Scenarios

A simple test hitting your homepage is a good start, but real users do not just visit one page. They follow paths, pause to read content, and interact with forms. Crafting a realistic user scenario is what separates a basic load check from a meaningful performance test. This means moving beyond a single HTTP Request and simulating a complete user journey.
You can create a user flow by sequencing multiple HTTP Request samplers. For an e-commerce site, this might look like: Homepage -> Search Results Page -> Product Detail Page -> Add to Cart. This sequence more accurately reflects how your server will be hit in the real world. However, a computer can execute these steps in milliseconds, which is not how people behave. This is where Think Time comes in. By adding a Timer element between samplers, you instruct JMeter to pause, simulating a user reading a page or thinking about their next action. This prevents your test from becoming an unrealistic denial-of-service attack and gives your server time to breathe between requests.
The next step toward realism is dynamic data. If all 100 of your virtual users log in with the same credentials or search for the same product, server-side caching can make your site appear much faster than it actually is. The CSV Data Set Config element solves this. You can create a simple CSV file with unique usernames, passwords, or search terms, and JMeter will feed a different value to each virtual user. This ensures you are testing your database and application logic, not just your cache. As you advance from jmeter scripting for beginners, you may find that modern web apps with complex JavaScript require more advanced techniques, but these principles remain the foundation. Ultimately, realistic testing helps protect the end-user experience, which is a critical component of both conversions and search rankings, as website speed is a key factor for ranking and user experience.
Analyzing Results to Pinpoint Bottlenecks
Running the test is only half the battle. The real value comes from turning raw data into actionable insights. The process of analyzing jmeter test results starts with focusing on three critical metrics found in listeners like the Aggregate Graph:
- Average Response Time: The average time users wait for a response after making a request. If this number climbs too high, users will leave.
- Throughput: The number of requests your server can handle per unit of time (e.g., per second). This is a direct measure of your site's capacity.
- Error Rate: The percentage of requests that failed. Any error rate above zero warrants investigation.
A performance bottleneck reveals itself when you correlate these metrics. As you increase the number of simulated users, you should see throughput climb. At some point, throughput will flatten out while response times and the error rate begin to rise sharply. That inflection point is your system's performance ceiling.
While JMeter is excellent at generating this load and reporting on server response times, it cannot see what is happening inside your server or in the user's browser. It simulates the traffic, but a Real User Monitoring (RUM) tool is needed to understand the impact. For example, you can see how your server's Time To First Byte (TTFB) degrades under load or how browser-based metrics are affected. With our tools, you can monitor the real Core Web Vitals your users experience during the test, providing a complete picture that JMeter alone cannot offer. Applying advanced data analytics techniques is valuable for uncovering subtle patterns within these complex datasets.
Advanced Strategies and Common Pitfalls
Once you have mastered the basics, this jmeter load testing tutorial can expand to more advanced strategies. Here are a few concepts to consider as you mature your performance testing practices, along with a critical limitation to keep in mind.
- Distributed Testing: A single machine can only generate so much traffic. For large-scale tests, JMeter can be run in a distributed mode, using a master controller to coordinate multiple slave machines that generate the load.
- CI/CD Integration: The most effective performance testing is continuous. By integrating your JMeter scripts into a CI/CD pipeline (like Jenkins or GitLab CI), you can automatically run tests with every new code deployment, catching performance regressions before they reach production.
- Acknowledging Limitations: It is crucial to understand that JMeter operates at the protocol level. It sends HTTP requests and receives responses, but it does not render HTML, parse CSS, or execute client-side JavaScript. This means it cannot measure the full front-end experience. For a complete view, you must complement JMeter with browser-based tools. Our platform shows how real user data provides insights that lab-based tools alone cannot capture, giving you a holistic view of performance.